NAV REITs Report Improving Monthly Total Returns for February
March 21, 2023 | James Sprow | Blue Vault
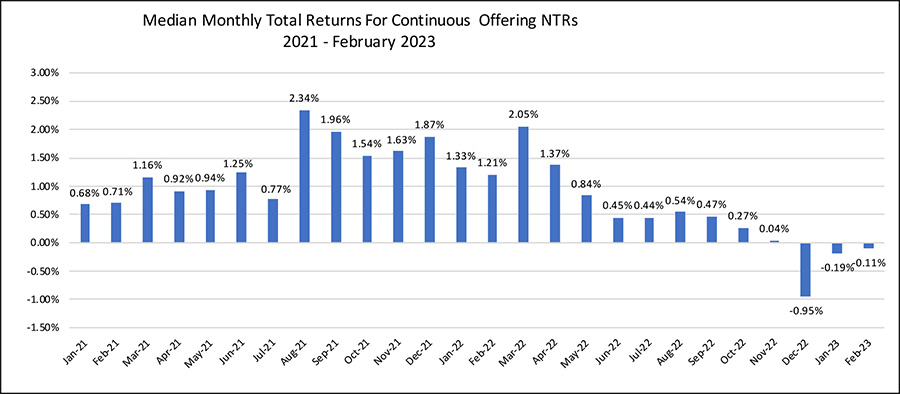
While the median monthly total return for 16 continuously offered nontraded REIT programs (“NAV REITs”) was slightly negative in February at negative 0.11%, seven of the 16 reported positive total returns. This is an improvement over the returns reported for January when the median total return for the same REITs was negative 0.19%. The nontraded REITs outperformed both the S&P 500 Index return for the month (negative 2.44%) and the NAREIT All REITs Index of listed REITs (negative 5.93%).
The newly registered NAV REIT from J. P. Morgan, J. P. Morgan Real Estate Income Trust, raised its NAV for Class I shares from $10.05 to $10.69, an increase of 6.37% for the month. The median change in per share NAVs for the 16 REITs was negative 0.54%, while the average change was benefitted by the J. P. Morgan REIT’s and tallied negative 0.25%.
Chart I
The seven NAV REITs with positive total returns in February included J. P. Morgan REIT at 6.72%, Cantor Fitzgerald Income Trust’s 0.83%, Starwood REIT’s 0.71%, Blackstone REIT’s 0.70% and FS Credit Real Estate Income Trust at 0.62%. Two other NAV REITs had total returns near zero for the month. Cottonwood Communities reported a large fall in its Class A NAV from $19.22 to $18.65, a reduction of 2.97%, which, adjusted for the distribution yield, resulted in a total return estimated at negative 2.65% for the month. InPoint Commercial Real Estate Income had a negative total return for the month of 1.47%, followed by JLL Income Property Trust at negative 0.98%. These were the three REITs with the most significant negative returns in February.
Chart II
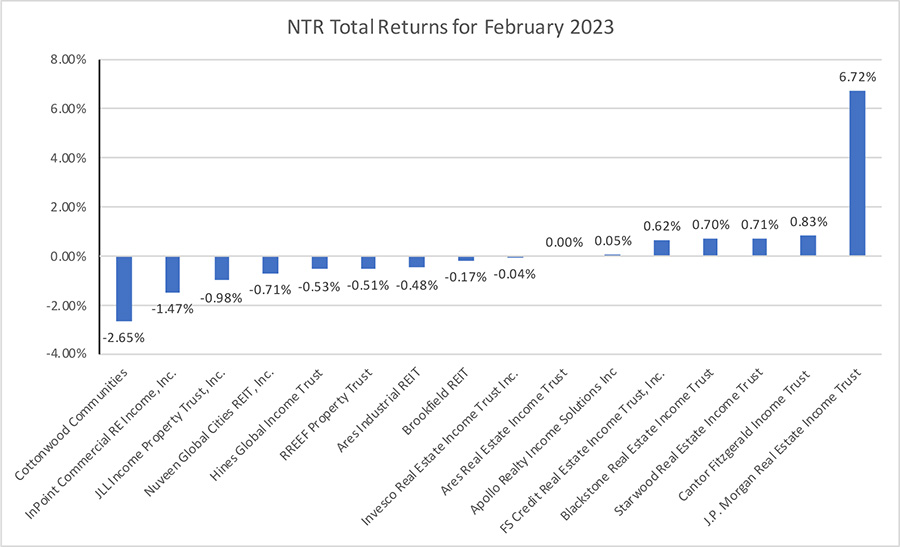
Chart III

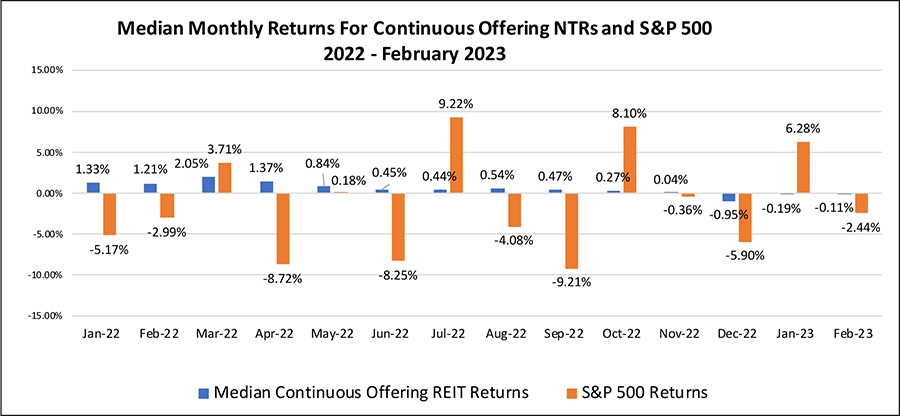
The favorable comparison in the relative volatility of the NAV REIT monthly returns is revealed when plotting the total returns of those REITs to the S&P 500 Index in Chart IV. The S&P 500 Index had a total of eight months in which returns were negative over the last 14 months while the nontraded REITs had only three.
Chart IV
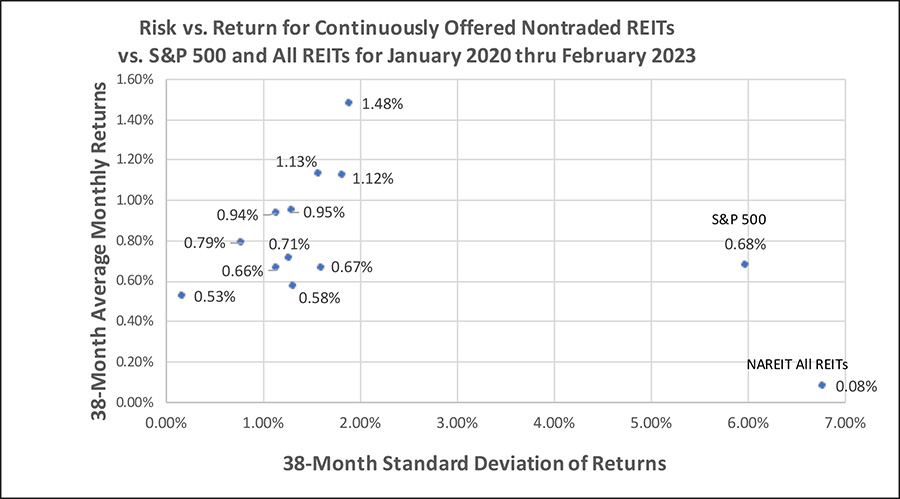
Investors who consider the risk vs. return data will appreciate the favorable trade-off found in nontraded REITs with their average standard deviation of monthly total returns at 1.27% compared to the much higher standard deviation of the S&P 500 Index returns at 5.98% over the last 38 months. The average monthly return for the 11 REITs with monthly return data over 38 months was 0.87% compared to that of the S&P 500 Index at 0.68%. This comparison implies that nontraded REITs not only have less risk but also have offered higher average returns than listed common stocks.
Chart V
The monthly returns for NAV REITs also compared very favorably to those of the listed REITs represented in the NAREIT All REITs Index. Chart VI shows that the listed REITs had more volatility than even the S&P 500 Index and a lower average rate of return over the last 38 months. Since January 2022, the listed REITs have had negative total returns in nine of 14 months. Since January 2020, the standard deviation of monthly total returns for the listed REITs index was 6.78% while the average monthly return of just 0.08% was less than 1% when annualized.
Chart VI
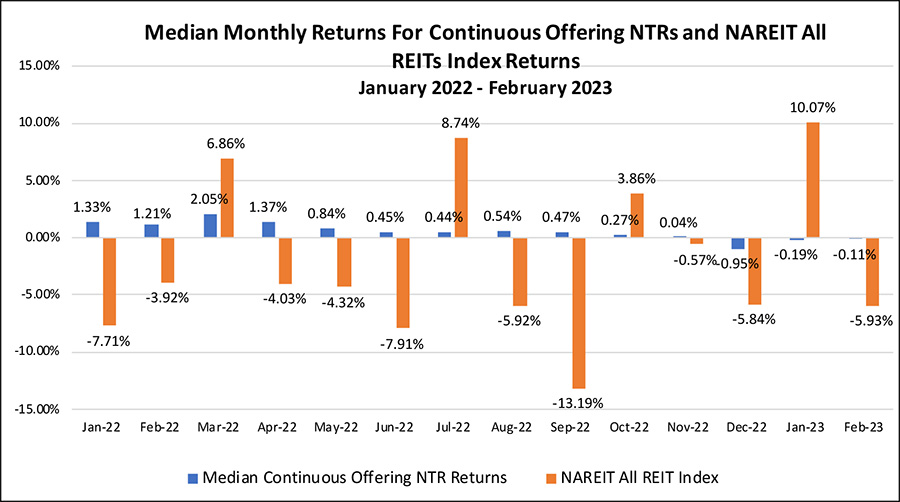
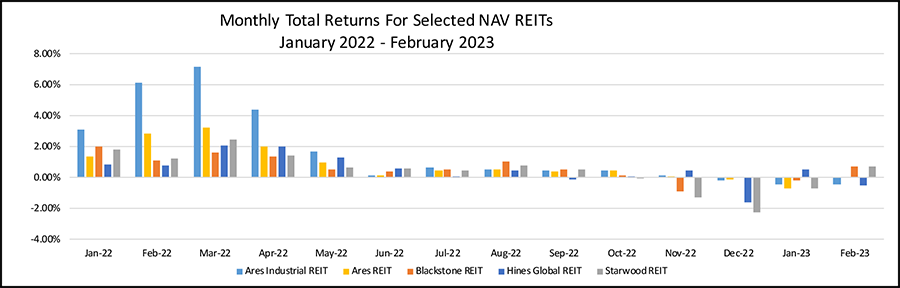
Chart VII vividly illustrates the decline in monthly total returns posted by the five largest NAV REITs. Beginning in June 2022, after a strong beginning to 2022, the REITs had modest monthly returns through October, but negative returns began to emerge in November and continued through January 2023. February began an upward trend in NAVs for these REITs that hopefully will continue in the remainder of 2023.
Chart VII
Sources: Blue Vault, Individual REIT Websites, S&P 500, NAREIT