August NTR Sales Reach High for Year, Up 8.5% From July
September 11, 2018 | James Sprow | Blue Vault

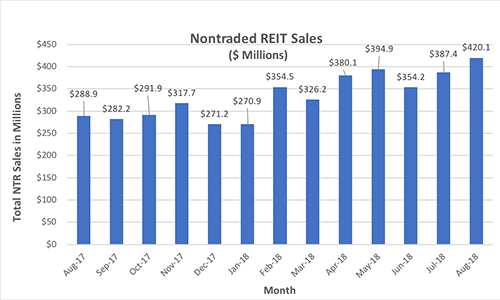
Nontraded REIT sales reached a high for the year at $420.1 million, up from $387.4 million in July and over 45% higher than August 2017. This is the highest monthly NTR sales total since Q1 2017 when Blackstone REIT began impacting the industry. Since January 2018’s $270.9 million in sales, the industry has averaged an increase of 7.9% per month.
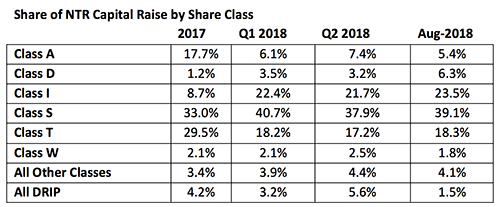
It is interesting to see the changes in the sales by share classes for nontraded REITs in 2018 compared to 2017. The following table illustrates the share of total nontraded REIT capital raise by each individual share class. The August trend (as it was in July) is away from Class A share sales toward Class D shares. In 2017 Class A shares made up 17.7% of the shares issued in open REIT offerings, but in August that percentage had dropped to just 5.4% of shares issued, while Class D shares increased from just 1.2% of shares issued in 2017 to 6.3% in August. Not all nontraded REIT sponsors have broken out distribution reinvestment programs (DRIP) proceeds in their capital raise reports, making DRIP comparisons less meaningful.
Blackstone REIT continued to dominate the NTR sector with $281.5 million in August capital raise, up from $233.1 million in July, raising 67.0% of all capital in the sector. Among other REITs, Griffin-American Healthcare Trust IV, Inc. was next with $23.3 million for a 5.6% share, followed by Black Creek Industrial REIT IV with $18.6 million and a 4.4% share. Cole Real Estate Income Strategy (Daily NAV), Inc. raised $16.5 million, followed by Black Creek Diversified Property Fund at $14.8 million. Of these programs, all but Griffin-American Healthcare Trust IV revise their offering prices either daily or monthly based upon revised estimated NAVs per share and are continuous offerings.
Among the sponsors of nontraded REIT offerings, Blackstone’s single offering raised 67.0% of the total for all nontraded REIT sponsors. Black Creek Group, with two open programs was next with $33.4 million raised for 8.0% of nontraded REIT sales, followed by Griffin Capital Company with two programs totaling $27.1 million in sales for 6.5% of the industry total, and CIM Group (formerly Cole Capital) with $18.2 million and a 4.3% share. Most industry insiders believe that approximately 90% of Blackstone REIT’s sales are coming via wirehouses. Blue Vault has asked Blackstone to report the breakdown by channel but as of yet Blackstone has not been responsive to these requests. Of all the industry’s Class S sales, Blackstone’s share was over 95%, and the REIT’s share of Class I sales for the month of August was 84%.
Among the REITs with significant increases in capital raised between July and August, the largest percentage increase was achieved by RREEF Property Trust, Inc., from $3.3 million in July to $7.7 million in August, an increase of 135%. Steadfast Apartment REIT III, Inc. increased sales from $5.1 million in July to over $8.4 million in August, a 65% increase. Hines Global Income Trust raised over $6.7 million in August, up from $4.9 million in July, a 37% increase.
Nontraded BDC Sales Up 58.5% In August
Nontraded BDC sales increased from $26.9 million in July to $42.6 million in August, a rise of 58.5%, with only three nontraded BDC programs raising funds in August compared to six in April and seven in February. Owl Rock Capital Advisors again led nontraded BDC sponsors with sales of $39.2 million by its Owl Rock Capital Corporation II program, 92% of all nontraded BDC sales in August, up almost 66% from its $23.6 million sales in July. MacKenzie Realty Capital was a distant second with $3.1 million in sales for a 7.3% share of all BDC sales, but with August sales 12% higher than in July. CION Investment Corporation reported sales of $0.33 million in August, just 0.8% of nontraded BDC sales for the month.