Stacy Chitty, Maria Smorgonskaya, and James Sprow | Blue Vault |
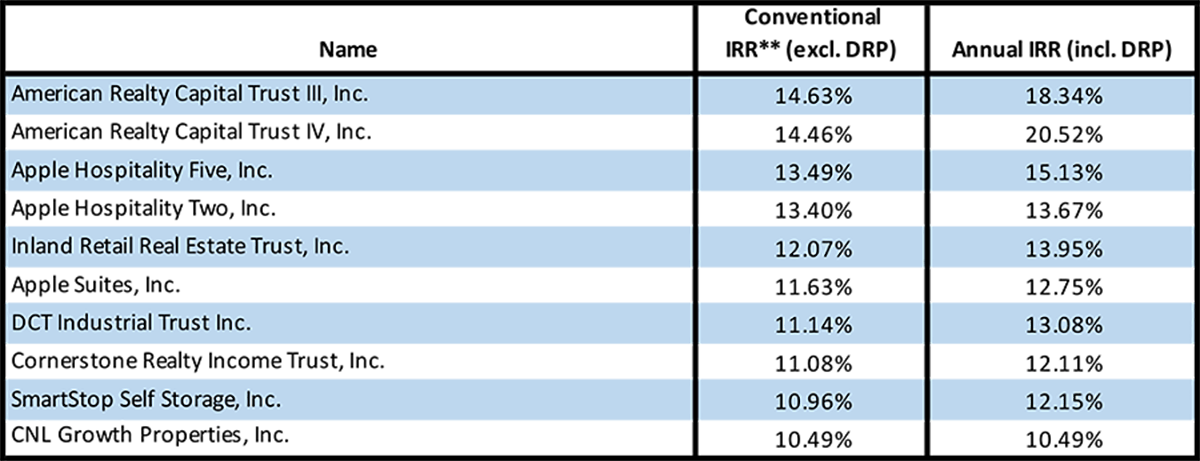
The nontraded REIT industry has been criticized in the past for its high fees and its lack of liquidity. Yet many, and some would argue most, nontraded REITs have performed well. Blue Vault has been tracking nontraded REIT full-cycle performance since 2012 when our first edition, containing 17 REITs, of the Blue Vault Nontraded REIT Full-Cycle Performance Study was launched. To be clear, at that time, there had only been 17 actual full-cycle events. Since that time, four supplementary editions of the Study have been released with 38 additional nontraded REIT liquidity events. The average annualized total return for all 55 fully-liquidated REITs is 6.13% for early investors. With distribution reinvestment, the average annualized total return is 6.52%. The ten highest total returns belong to the following REITs:
Blue Vault will be analyzing the top stories from their 5th Edition Study over the coming weeks in an effort to present the facts, good and bad, of nontraded REIT performance. In addition, Blue Vault will be analyzing the performance of perpetual life REITs, which have been the preferred REIT structure of recent years. Please click here to view 2018 perpetual life REIT total returns
To view a listing of all 56 total return results from the entire series of Blue Vault studies on nontraded REIT full-cycle performance, click here.
Blue Vault subscribers may view the actual studies in their entirety and the hundreds of data points that are contained in the studies, including custom benchmark comparisons to the FTSE NAREIT index of traded REIT performance, the NCREIF Index of institutional portfolio performance, as well as comparisons to the S&P 500 stock index and U.S. Treasury bonds. Blue Vault’s custom benchmarks are unique in the industry and adjust for the effects of leverage, property types, geographic diversity and differences in costs of debt.
Blue Vault-Trusted Transparency since 2009