Johnathan Rickman | Blue Vault
Investors defied lingering concerns about the private credit sector in the third quarter of 2025, boosting the nontraded business development company (BDC) industry’s fundraising and asset levels to new, record highs, Blue Vault data shows.
The industry enjoyed a fourth consecutive quarter of growth while continuing to generate robust total returns. Those results come as the private credit sector — projected to reach $5 trillion by 20291 — has come under increased scrutiny amid worries by regulators and others that unchecked sector growth could amplify economic shocks and spur another financial system meltdown2.
Some of those worries have prompted a flurry of redemption requests in more recent months. According to reporting by Wealth Management3, BDCs impacted by the exodus have honored redemption requests and continue to generate more inflows than outflows.
Now, let’s take a closer look at the data4 that has supported the ongoing industry boom.
Capital Raise
Public capital raise for the nontraded BDC industry reached a new high in the third quarter, generating an estimated $10.1 billion, including DRIP proceeds. This is up from the $9.6 billion raised in the second quarter of 2025. Private fundraising for BDCs reached an estimated $3.4 billion in Q3 2025, up from the $3.1 billion raised Q2 2025.
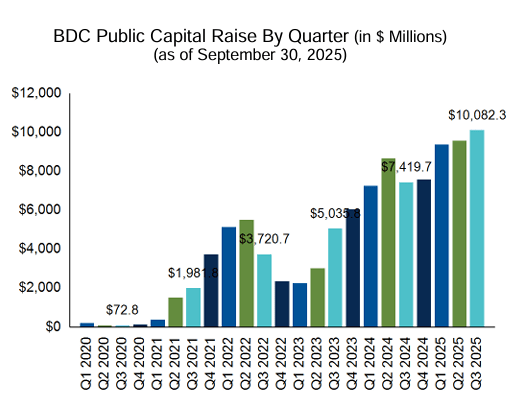
The biggest fundraiser, Blackstone Private Credit Fund, has generated approximately $34.0 billion in its public offering since being introduced in 2021, including $1.9 billion in the third quarter. The two nontraded BDCs sponsored by Blue Owl — Blue Owl Credit Income Corp. and Blue Owl Technology Income Corp. — have together raised an estimated $21.8 billion in their public offerings since inception, including $2.0 billion in the third quarter.
The following were the top five fundraisers in the first nine months of 2025:
| Nontraded BDC | Effective Date | 2025 Public Capital Raise |
| Blackstone Private Credit Fund | 1/7/2021 | $6.2 billion |
| Blue Owl Credit Income Corp. | 11/10/2020 | $5.3 billion |
| Ares Strategic Income Fund | 12/5/2022 | $4.5 billion |
| HPS Corporate Lending Fund | 2/3/2022 | $3.6 billion |
| Apollo Debt Solutions BDC | 1/7/2022 | $2.2 billion |
Asset Levels
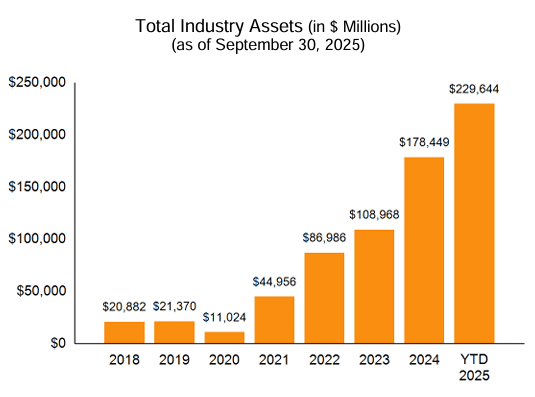
The nontraded BDC industry now has $229.6 billion in assets under management, up from $45.0 billion at the end of 2021, $87.0 billion at year-end 2022, $109.0 billion at year-end 2023, and $178.4 billion at year-end 2024.
Not only is Blackstone the industry’s top fundraiser, but it also reported the most assets at $80.3 billion as of September 30, 2025. That’s more than double that of the runner-up, Blue Owl Credit Income Corp., which reported $34.8 billion in assets as of the same period. Apollo Debt Solutions BDC came in third with $24.6 billion as of September 30, 2025.
Total Return and Distribution
Returns for the year continue to be strong with all but two offerings posting positive total returns as of September 30, 2025.
The median industry return through the first nine months of 2025 was 6.38%, while the average return for the same period was 5.83%. Note: The median and average industry returns only include those funds that were in operation for the entire period.
As of September 30, 2025, the industry’s average distribution yield was 9.07%. At the end of Q3, the five funds with the highest distribution yields across share classes were PGIM Private Credit Fund, Kennedy Lewis Capital Company, Blackstone Private Credit Fund, TPG Twin Brook Capital Income Fund, and BlackRock Private Credit Fund:
| Nontraded BDC | D Share | I Share | S Share |
| PGIM Private Credit Fund | 10.97% | 11.60% | 10.14% |
| Kennedy Lewis Capital Company | N/A | 10.66% | 9.48% |
| Blackstone Private Credit Fund | 10.17% | 10.57% | 9.39% |
| TPG Twin Brook Capital Income Fund | 10.34% | 10.50% | 9.55% |
| BlackRock Private Credit Fund | 9.99% | 10.40% | 9.21% |
Other nontraded BDCs with double-digit distribution yields for their I shares in Q3 include First Eagle Private Credit Fund (10.37%) and Oaktree Strategic Credit Fund (10.05%).
As of September 30, 2025, Blue Vault tracks 22 open and 2 closed publicly offered, nontraded BDCs. Of those, only 10 open offerings have fully covered their distributions, posting year-to-date 2025 net investment income payout ratios of 100% or less.
Operating Expenses
Most of the nontraded BDCs tracked by Blue Vault had annualized gross operating expense ratios of between about 3% and 6% in Q3 2025, with one exception: Prospect Floating Rate and Alternative Income Fund, whose ratio posted at 8.51%. We calculate that metric as annualized total expenses (less interest expense) divided by average equity for the period. While management and administrative expenses are typically an offering’s biggest expense, lower ratios indicate better efficiency in managing operating costs.
Don’t Go It Alone
Learn about Blue Vault membership and how our performance data can help protect your clients, and as such, your advisory practice. Our research includes historical and current data on nontraded REITs, nontraded BDCs, interval funds, tender offer funds, and preferred share stock. Our coverage also includes capital market overviews, financing outlooks, individual performance profiles, and updates on product launches and full-cycle events.
With the launch of Blue Vault’s new portal in the coming two weeks, wealth advisors can sort, filter, and analyze private credit and private real estate offerings like never before.
Are you an asset manager, broker-dealer, or other firm serving the alts industry? Contact us today to view a full demo of our unparalleled research offerings.
References
1 Understanding Private Credit’s Rapid Growth | Morgan Stanley, 10/3/2025
2 Private Credit’s Surge Has Investors Excited and Regulators Concerned | CFA Institute, 6/5/2025
3 Private Credit’s Biggest BDCs Grappling With Investor Exodus | Wealth Management, 1/9/2026
4 Blue Vault Nontraded BDC Industry Review: Third Quarter 2025