Johnathan Rickman | Blue Vault
As direct lending continues to attract consumers seeking flexible financing in an uncertain market, nontraded business development companies (BDCs) stand to play an important role in preserving entrepreneurship for years to come. They’re also currently playing a big role in generating income for investors, as second quarter 2025 Blue Vault data show.
The nontraded BDC industry experienced a third consecutive quarter of growth in Q2 while generating robust total returns through the first half of the year. And as concerns grow about the quality of managed debt amid spiking interest in private credit, non-accrual rates among the active offerings tracked by Blue Vault remain below 1%, with most under 0.5%.
“There’s been no significant shift toward unsecured or subordinated debt, and senior debt continues to dominate portfolios, typically over 96%,” said Luke Schmidt, Vice President, Director of Research at Blue Vault. “While this could evolve as portfolios season, current performance among nontraded BDCs remains strong.”
With the private credit market projected to grow between $2.8 and $3.5 trillion by 20281, the industry is experiencing a resurgence and performing well overall. Now, let’s take a closer look at the data2 and the metrics that have helped spur the recent industry boom.
Capital Raise
Public capital raise for the industry reached a new high in Q2 2025, generating an estimated $9.6 billion, including DRIP proceeds. This is up slightly from the $9.4 billion raised in Q1 2025 and $7.5 billion in Q4 2024. Private fundraising reached about $3.1 billion in Q2 2025, down from the $3.5 billion raised Q1 2025 but still above the $2.3 billion raised in Q4 2024.
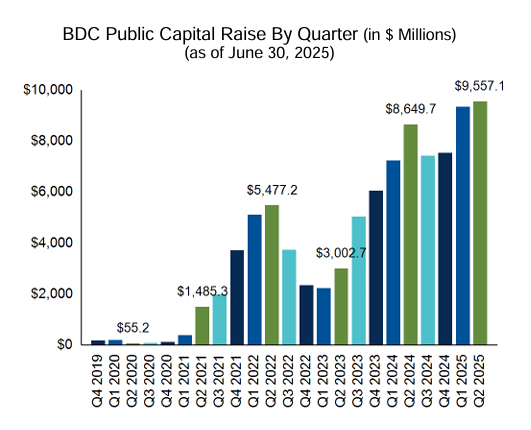
Some of the biggest fundraisers include Blackstone, whose Blackstone Private Credit Fund has generated approximately $32.2 billion in its public offering since being introduced in 2021, including $2.2 billion in the second quarter. The Blackstone fund and Blue Owl Credit Income Corp. raised a combined 39.9% of total industry new public capital in Q2 2025.
The following were the top five fundraisers in the first half of 2025:
| Nontraded BDC | Effective Date | 2025 Public Capital Raise |
| Blackstone Private Credit Fund | 1/7/2021 | $4.3 billion |
| Blue Owl Credit Income Corp. | 11/10/2020 | $3.4 billion |
| Ares Strategic Income Fund | 12/5/2022 | $2.7 billion |
| HPS Corporate Lending Fund | 2/3/2022 | $2.5 billion |
| Apollo Debt Solutions BDC | 1/7/2022 | $1.6 billion |
Asset Levels
The industry now has $212.2 billion in assets under management, up from $176.1 billion at the end of 2024. Nontraded BDCs have quadrupled their total assets since the end of 2021, boosting interest in the industry and prompting new product launches. Antares Capital and First Eagle both launched offerings weighted heavily in senior debt this year.
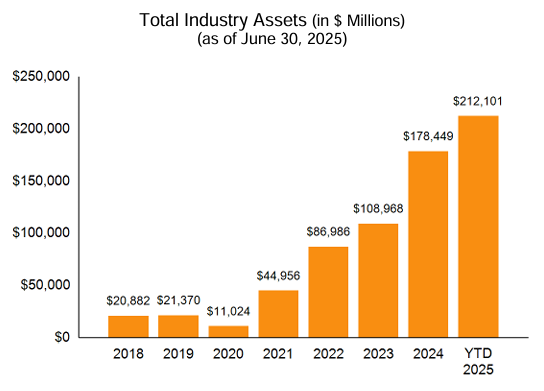
Not only is Blackstone the industry’s leading fundraiser, but it also reported the most assets at $76.7 billion as of June 30, 2025. That’s more than double that of the runner-up, Blue Owl Credit Income Corp., which owned $33.3 billion in assets as of June 30, 2025.
Total Return and Distribution
Returns for the year started off strongly with all but one BDC, NexPoint Capital Inc., posting positive returns. The median industry return through the first half of 2025 was 4.05%, while the average return for the same period was 3.72%. Note: The median and average industry returns only include those funds that were in operation for the entire period.
As of June 30, 2025, the industry’s average distribution yield was 8.95%. At the end of Q2, BlackRock Private Credit Fund and PGIM Private Credit Fund had the highest distribution yields across share classes:
| Nontraded BDC | D Share | I Share | S Share |
| BlackRock Private Credit Fund | 10.97% | 11.39% | 10.17% |
| PGIM Private Credit Fund | 11.00% | 11.62% | 10.17% |
Other BDCs with double-digit distribution yields for their I shares in the second quarter include AMG Comvest Senior Lending Fund (10.27%), Blackstone (10.49%), First Eagle (10.24%), Kennedy Lewis Capital Company (10.50%), Oaktree Strategic Credit Fund (10.37%), and TPG Twin Brook Capital Income Fund (10.43%).
Compared to the previous two quarters, Q2 2025 saw an uptick in the number of nontraded BDCs’ double-digit distribution yields across share classes:
| Reporting Period | Double-Digit Distribution Yields (I Shares) | Double-Digit Distribution Yields (all shares) |
| Q2 2025 | 8 | 15 |
| Q1 2025 | 6 | 12 |
| Q4 2024 | 6 | 11 |
Operating Expenses
As of June 30, 2025, Blue Vault tracks 21 open and 3 closed publicly offered, nontraded BDCs. Those offerings have annualized gross operating expense ratios of between about 3% and 6%. We calculate that metric as annualized total expenses (less interest expense) divided by average equity for the period. While management and administrative expenses are typically a fund’s biggest expense, lower ratios indicate better efficiency in managing operating costs.
Learn about Blue Vault membership and how our performance data can help build your advisory practice. Are you an asset manager, broker-dealer, or other entity? Contact us today to see how we can help you.
References
1 Private Debt: The multi-faceted growth drivers | BlackRock
2 Blue Vault BDC Industry Review: Second Quarter 2025