
NTR Performance and Property Sector Concentrations
January 28, 2020 | James Sprow | Blue Vault
 In looking at the total returns to shareholders reported by eleven nontraded REITs with continuous offerings and monthly or daily net asset value (NAV) reporting, it’s apparent that 2019 was relatively favorable to all of the programs. Every one of the eleven produced positive one-year returns and had distributions that averaged over 4.7% based upon their respective Q4 2019 distributions and prices per share. These positive returns to shareholders should not be surprising, given that pricing in each of the commercial real estate sectors showed positive increases.
Digging deeper, we can examine the property portfolios of each of the eleven nontraded REITs and see if there is a relationship between the concentrations of those portfolios by property type and the 2019 total returns each reported.
In Table I below, we show the one-year 2019 total returns to shareholders in Class T common shares for ten REITs and Class A shareholders for one REIT. These returns are reported on each of the REIT’s websites, without sales loads. The one-year total returns range from 10.78% for the Class T shares of Blackstone Real Estate Income Trust to 2.81% for Griffin Capital Essential Asset REIT’s Class A shareholders.

In Table II, we show the property counts as of January 2020 for each of the REIT portfolios. These counts do not reflect the market values of the properties or their book values, but they give an idea as to how each REIT has deployed its investment capital in commercial real estate properties. What is particularly interesting is how the property sector concentrations of these REIT portfolios and the price increases in 2019 of the different sectors tend to explain the one-year 2019 total returns. For example, the highest one-year return among the eleven REITs for the shareholders in Blackstone Real Estate Income Trust could be explained to some degree by the fact that the REIT had more properties in the industrial and multifamily sectors, where the highest price increases occurred, and very few in the retail sector, where price increases were lower. Below the table we show the one-year 2019 price appreciation by sector as reported by Real Capital Analytics and Green Street Advisors.
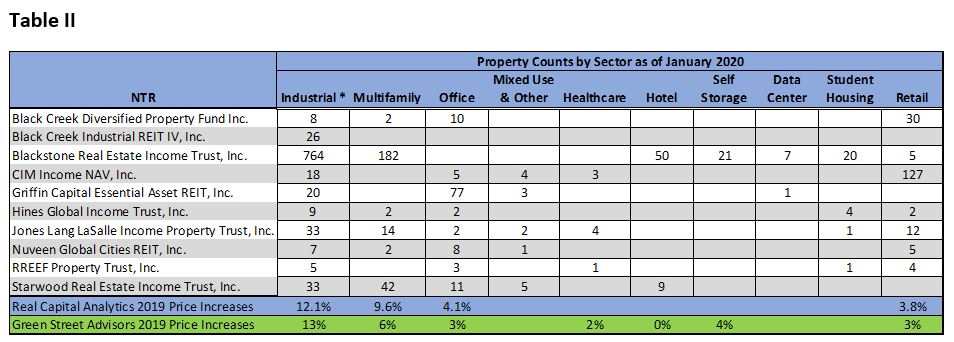
On the other end of the return spectrum, notice that CIM Income NAV, with a high concentration of properties in the retail sector, had the second lowest total return to Class T shareholders in 2019. Looking forward to full-year returns in 2020, it will be interesting to see if sector pricing trends for the different commercial real estate types are again reflected in the returns of these nontraded REITs. Real estate portfolios typically have low turnover, meaning the portfolio concentrations by property type are unlikely to change significantly in 2020, especially for those REITs that have been in existence for more than a few years. It is conceivable that price trends for the different sectors will be quite different in 2020. Could retail property pricing make a come-back? Will industrial sector pricing again lead the way? In January 2021 we could be reporting an entirely different ranking of one-year total returns for these REITs.
To find out more about each REIT sponsor, click below:
- Black Creek Diversified Property Fund Inc.
- Black Creek Industrial REIT IV, Inc.
- Blackstone Real Estate Income Trust, Inc.
- CIM Income NAV, Inc.
- FS Credit Real Estate Income Trust, Inc.
- Griffin Capital Essential Asset REIT, Inc.
- Hines Global Income Trust, Inc.
- Jones Lang LaSalle Income Property Trust, Inc.
- Nuveen Global Cities REIT, Inc.
- RREEF Property Trust, Inc.
- Starwood Real Estate Income Trust, Inc.
Sources: REIT websites, S&P Global, Real Capital Analytics, Green Street Advisors, Blue Vault