Owning several BDCs may diversify your exposure across managers.
But how different are the portfolios underneath them?
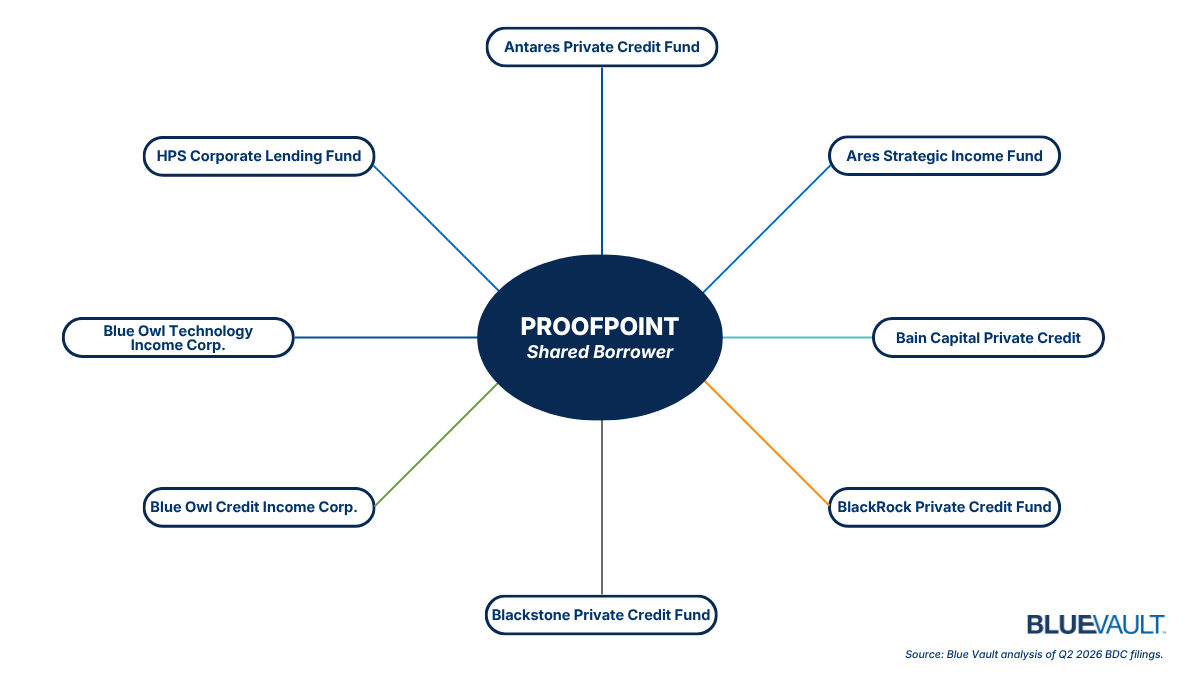
Blue Vault’s analysis of Q2 2026 BDC filings identified Proofpoint in eight BDC portfolios spanning seven different manager organizations.
The eight BDCs are:
- Antares Private Credit Fund
- Ares Strategic Income Fund
- Bain Capital Private Credit
- BlackRock Private Credit Fund
- Blackstone Private Credit Fund
- Blue Owl Credit Income Corp.
- Blue Owl Technology Income Corp.
- HPS Corporate Lending Fund
What Does That Tell Us?
Not necessarily what you might think.
Finding the same borrower in multiple BDC portfolios does not mean the investments are identical. Different BDCs may hold different securities, tranches, maturities, structures or position sizes in the same borrower.
And portfolio overlap, by itself, isn’t inherently good or bad.
But it does raise an important question for advisors who own—or are considering—more than one BDC:
Does manager diversification also mean borrower diversification?
Owning multiple BDCs may provide exposure to different managers and portfolios. Looking beneath the fund level can provide another perspective: where those underlying portfolios may intersect.
And that’s where the analysis gets more interesting.
Now Add the Blue Vault Data
Portfolio holdings tell us what’s inside the BDCs. Blue Vault’s standardized data lets us examine the products themselves through a consistent comparative framework.
Across the 23 BDCs in Blue Vault’s Q2 comparison set:
Those figures come from Blue Vault’s proprietary standardized Q2 BDC dataset.
And they lead naturally to another question:
Does More Capital Raised Mean Higher ROE?
Blue Vault compared Q2 gross capital raised with quarterly ROE across all 23 BDCs in the analysis.
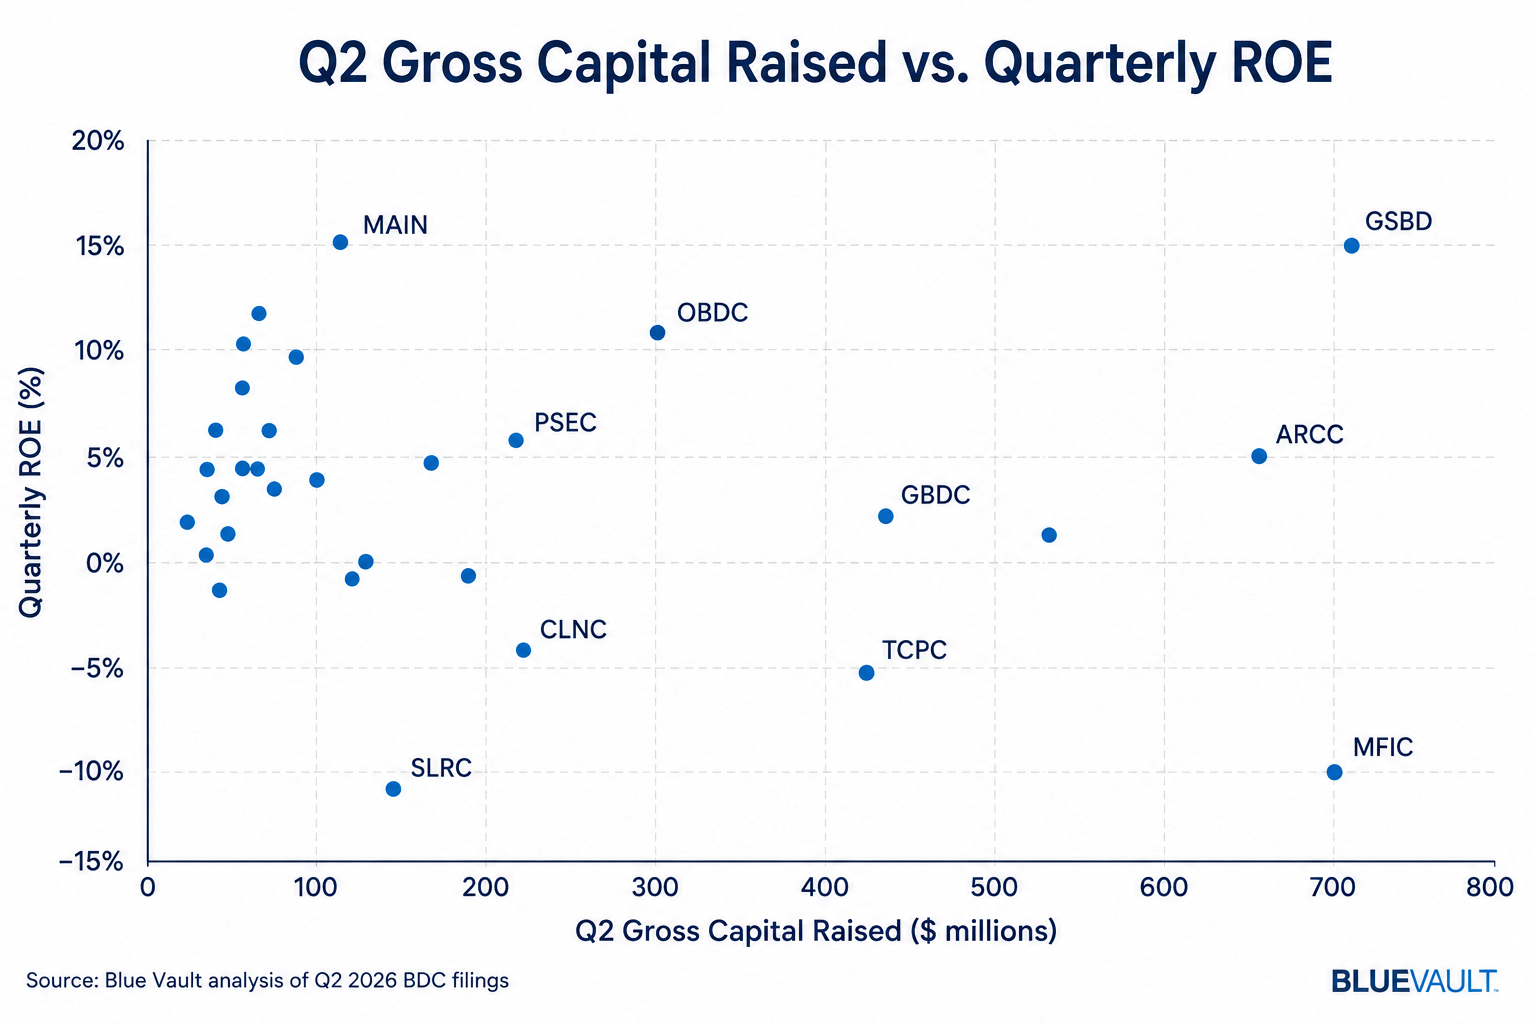
The results show a wide range of outcomes.
Some BDCs with relatively modest Q2 capital raising generated comparatively strong quarterly ROE, while the largest capital raisers produced a wide range of ROE outcomes.
That doesn’t mean capital raising causes higher—or lower—ROE.
It does demonstrate why a single metric rarely tells the whole story.
Capital raised tells you one thing. ROE tells you another. Portfolio holdings add another layer still.
The value comes from being able to put those pieces together.
Want to Go Deeper?
This analysis highlights only part of what’s available in Blue Vault’s complete Q2 BDC dataset.
Financial advisors can access Blue Vault at no cost to compare BDCs and explore the metrics that matter to their own analysis.
Explore the Complete Q2 BDC Data
Don’t have a Blue Vault account? Create a free account here.
Source & Methodology
Blue Vault performance and market statistics are derived from Blue Vault’s proprietary standardized BDC dataset. Portfolio-holdings observations are derived separately from Q2 2026 BDC filings. Holdings in the same borrower may consist of different securities, tranches, maturities or position sizes. Portfolio overlap alone should not be interpreted as an indication of investment quality or risk.
Information is intended only for institutional, broker dealer or registered investment adviser use. This information is prohibited for use by the general public. Past performance is not indicative of future results.