Maria Smorgonskaya | Blue Vault
In this article, Blue Vault Partners compares the most recent NAVs, estimated by nontraded REITs, to the previous NAVs reported by the REITs. To make the comparison meaningful, we need to group all the existing REITs based on the NAV estimation frequency. We consider five different groups: REITs updating NAVs monthly or daily, REITs updating NAVs annually, other updating intervals, liquidating REITs, and REITs with no data for comparison.
There are 68 REITs in our sample as of the end of January 2019. The first category, REITs updating NAVs annually, includes 33 REITs. The second category, REITs updating NAVs Monthly or Daily, includes 8 REITs. The other REITs group includes 10 REITs, which estimate their NAVs on three-months basis or nine-month intervals, or sometimes use another time frame. The last two subgroups we are considering are liquidating REITs, consisting of the one REIT in the Liquidating life stage, and the REITs with no data for comparison, where we include REITs with no NAV and REITs with the NAV estimated only once as of today. There are 16 such REITs in our sample. See Table I.

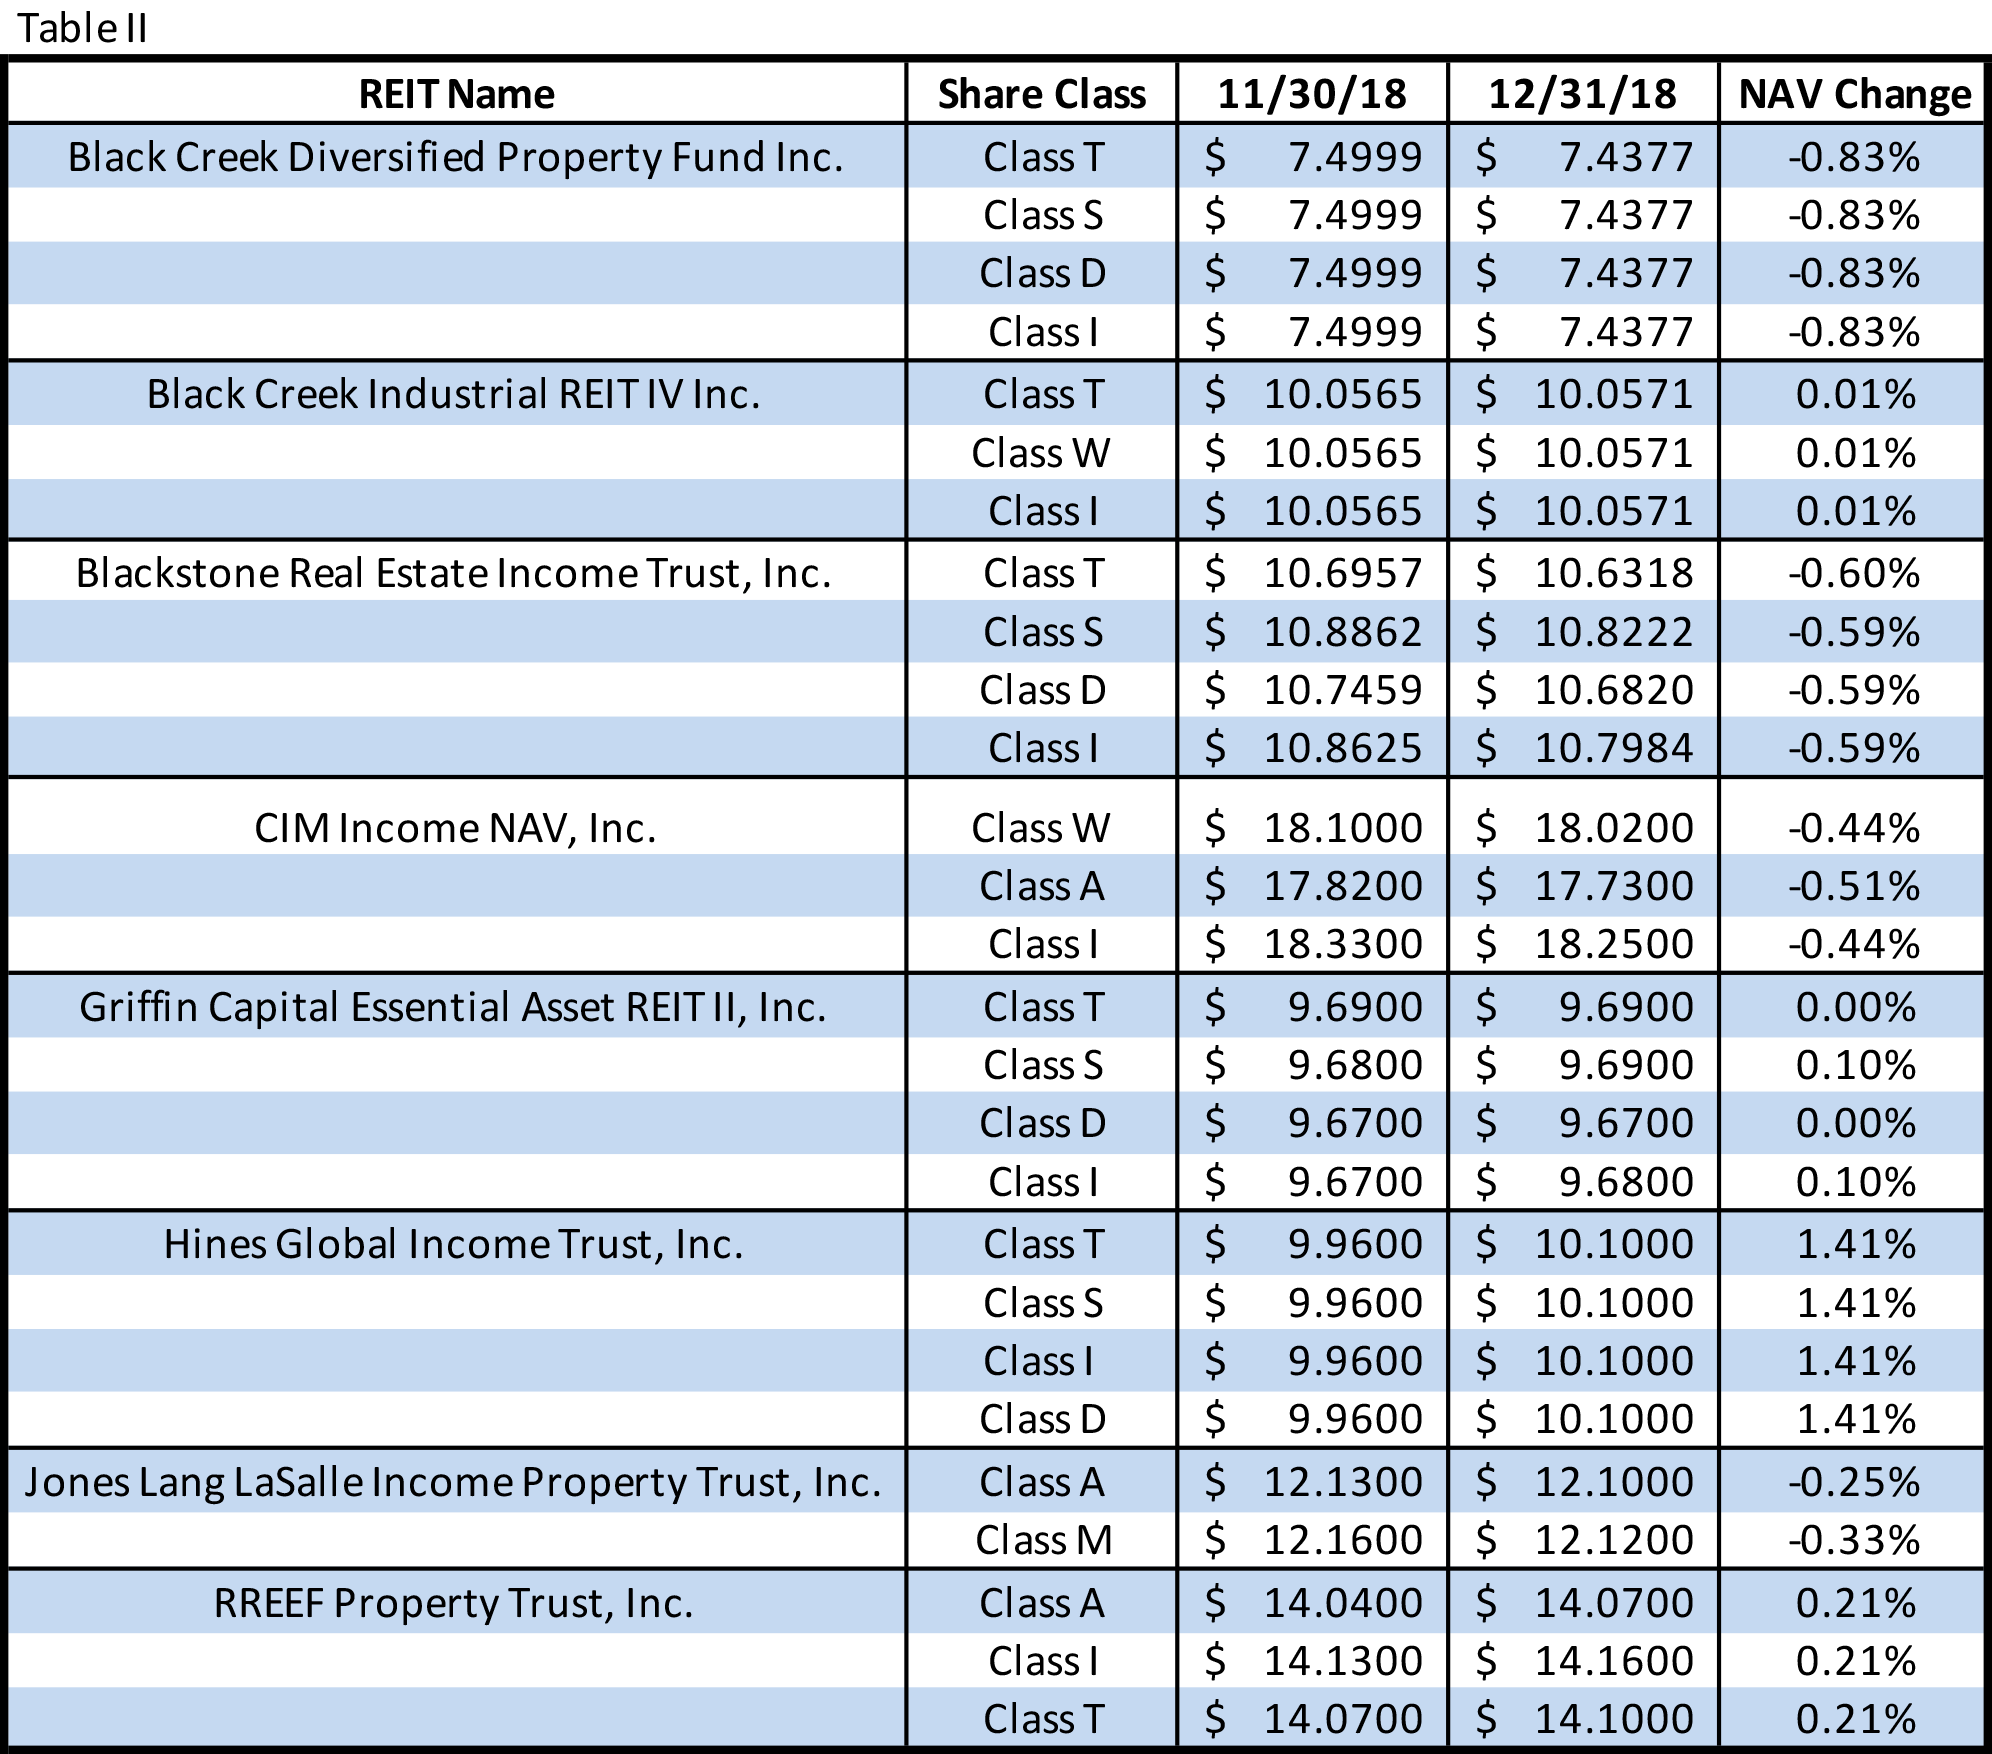
For the REITs which update their NAVs monthly or daily, for the purpose of comparison we used NAVs as of December 31, 2018, and NAVs as of November 30, 2018.
Based on the data in Table I, approximately half of the REITs with annual NAV updates reported an increase in their NAVs. Similarly, half of the REITs with Monthly and Daily NAVs experienced either an increase or no change in their respective NAVs. For Other REITs we can say that more REITs experienced a decrease in their NAVs, but due to the small sample size of 10 REITs, the difference is not significant.
Related: Daily and Monthly NAV Nontraded REIT Performance Review for 2018
Among the eight REITs which updated their NAVs on a monthly or daily basis, the average percent of increase in NAVs was lower (0.46%) than the average percent of decrease (-0.59%). Those results are based on the data presented in Table II.

For the REITs, which updated their NAVs in 2018, but more frequently than on the annual basis, the situation is the opposite (see Table III). The average increase in the NAVs (+1.32%) was lower than the average decrease (-4.65%). At the same time, we should admit that the subsample is limited to six REITs.

A special case in this article is American Realty Capital Healthcare Trust III, Inc, a REIT in the liquidating LifeStage©. In the Plan of Liquidation, the board of directors ceased declaring and paying regular distributions to the stockholders following the distributions to stockholders of record with respect to each day during the month of July 2017. On July 18, 2017, the independent directors of the board of directors unanimously approved an estimated per-share net asset value of common stock as of July 18, 2017, equal to $17.64. On January 5, 2018, the Company paid an initial liquidating distribution of $15.75 per share of common stock pursuant to the Plan of Liquidation. In light of the closing and the payment of the Initial Liquidating Distribution, the independent directors of the board of directors updated the July Estimated Per-Share NAV, and, on January 8, 2018, the REIT revised the estimated per-share NAV equal to $1.89 as of January 5, 2018.
On October 25, 2018, the independent directors unanimously approved an estimated per-share net asset value of common stock equal to $2.27 as of September 30, 2018.
Sources: SEC, Blue Vault


