Starwood REIT Announces Lower NAVs Per Share

May 7, 2020
Starwood Real Estate Income Trust, Inc, a perpetual-life monthly NAV REIT sponsored by private investment firm Starwood Capital Group, announced lower per share net asset values for its Class S, Class I, Class D and Class T shares of common stock as of March 31, 2020.
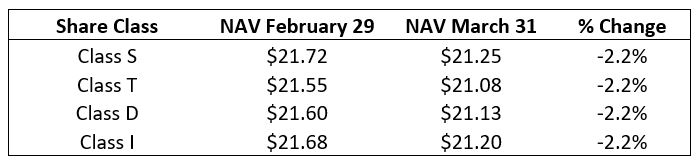
Shares were initially priced at $20.00 each plus applicable selling commissions and fees.
According to the filing:
“COVID-19 continues to impact virtually every part of the U.S. economy. The decrease in the March 31, 2020 NAV was principally driven by the two smallest allocations in our portfolio:
1. Securities: 8% of our portfolio is invested in marketable securities in order to provide us with liquidity for our share repurchase program. As of the end of March, the securities allocation was approximately 91% invested in seasoned residential mortgage backed securities (“RMBS”) and approximately 9% invested in commercial asset backed securities. In the middle of March, the capital markets experienced severe volatility as a result of market dislocation. Values have since rebounded, much like the equity markets have, and stabilized thanks to the Federal government’s tremendous injection of liquidity into the system.
2. Hotels: Less than 7% of our portfolio is invested in branded, select-service hotels. As a result of unprecedented travel declines and stay at home orders due to COVID-19, our portfolio hotel occupancies declined from approximately 83% in February to approximately 45% by the end of March.
Despite the month-over-month change in NAV, there are positive developments in our portfolio in light of the recent economic turbulence:
1. April 2020 Rent Collections: To date, our April 2020 rent collections across the multifamily, office and industrial properties have been extremely positive. As of April 14, 2020, we had collected 91% of our rental income, while on the same day in March 2020, we had collected 92%. To date, we have received a limited number of requests from our tenants seeking rent relief.
2. Office (34%): Our office properties are 93% occupied and have been the best performing segment across our portfolio from a rent collections perspective, with collections exceeding 93%, or 4% above what they were on March 14, 2020. We believe this is due to (a) high credit quality tenants, (b) long weighted average lease terms exceeding five years on average (with negligible rollover during the next 12 months), and (c) less than 3% total exposure of the sectors experiencing the most severe impact from the crisis: retail, travel, tourism, hospitality, manufacturing and co-working space. We are monitoring our transient parking income, which is showing signs of weakness, but is also not material to our asset values on the whole.
3. Multifamily (44%) and Industrial (9%): Our multifamily and industrial/logistics assets also continue to hold up well. Our multifamily properties are 95% occupied and multifamily has typically been the most resilient asset class during downturns and that continues to persist. Our industrial/logistics assets are 98% occupied and are located in stable Midwest (domestic logistic hub) markets like Chicago, Indianapolis and Columbus. We have minimal exposure to manufacturing tenants and no coastal or port driven logistics assets being disrupted by the shutdown of global supply chains.
April 2020 Rent Collections Update
As of April 30, 2020, we had collected 97% of rent across all asset classes vs. 97% for the prior month at the same time. Listed below, along with the percentage each asset class comprises of our investments in real properties, is a breakdown of current rent collection as of April 30, 2020:
• Multifamily (44%) is 96% collected vs. 97% the prior month at the same time
• Office (34%) is 98% collected vs. 97% prior month at the same time
• Industrial (9%) is 97% collected vs. 97% prior month at the same time
• Hotel (7%) occupancies declined from month-end March at 45% to 18%
• Medical Office (6%) is 93% collected vs. 95% prior month at the same time”
Source: SEC