
Understanding the Recent NAV Changes at Cottonwood Communities
August 19, 2021 | James Sprow | Blue Vault
 On August 17, Cottonwood Communities announced a net asset value per share (“NAV”) for their outstanding Class A and Class TX shares and for their Operating Partnership interests of $12.54 per share, as of July 31, 2021. This represented a 6.67% increase in their NAV from the $11.79 as of June 30, 2021, just 31 days earlier. Blue Vault sought to explain the unusual increase by exploring the recent changes at the nontraded REIT, including the mergers with Cottonwood Residential II and the change in the Operating Partnership from Cottonwood Communities O.P. to Cottonwood Residential O.P.
The first valuation came out May 7 at $10.8315. The NAV as of May 31, 2021, was $10.8488, an increase over 24 days of 0.16%. However, the June 30, 2021, NAV per share was announced as $11.7865, an increase of 8.64%. In July, the NAV increased again, up 6.37% to $12.54. The bulk of the increases were due to a decrease in cap rates used to value the REIT’s net cash flows, and an increase in rents from their multifamily properties. The multifamily sector, in general, has had a very positive year, with sustained occupancy levels, high rent collections, and increasing valuations. There was also a change in Cottonwood’s NAVs due to the accrued performance participation allocation, which was “in the money” in June after having a GAAP book value of zero earlier in the year.
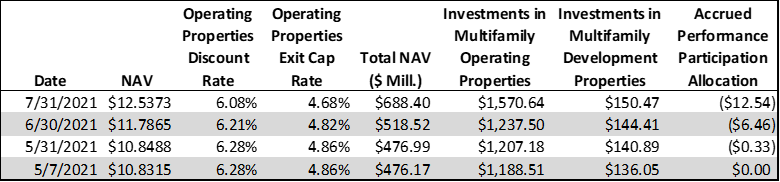
As part of the mergers that closed May 7, 2021, the REIT now owns the property management company that was part of Cottonwood Residential II, Inc., and that property management company has a promoted interest. In May, that promoted interest was valued at $0 because it wasn’t “in the money.” When property values reached a certain point and based upon performance, the promoted interest became “in the money.” According to the REIT’s 10-Q for Q2 2021, “We manage properties on behalf of third parties and under certain agreements have contractual rights to receive promotional interests subject to minimum return hurdles. We do not recognize promotes under GAAP until a liquidation transaction is probable, but do include the fair value of promotes, using a hypothetical liquidation valuation method, for purposes of determining our NAV.”
According to Thayer Gallison at Cottonwood Communities, the merger that they completed in May added properties that have since appreciated as compared to their values at the time of the merger, which benefitted the NAV per share. With the increased portfolio size, the REIT also enjoys economies of scale in terms of General and Administrative expenses spread over a larger portfolio.
About Cottonwood Communities
Cottonwood Communities Advisors, LLC is the sponsor of Cottonwood Communities, Inc., a nontraded REIT, and is a fully integrated real estate company focused exclusively on the multifamily asset class. As of June 30, 2021, the REIT owned interests in 29 multifamily apartment communities totaling 8,373 units, including 1,079 units in four multifamily apartment communities under construction. In addition, the REIT had preferred equity investments in three multifamily apartment developments totaling 1,073 units, a mezzanine loan in one multifamily apartment development, two parcels of land held for development as well as various smaller real estate investments. The REIT also manages 20 properties for third parties, bringing the total number of multifamily apartment communities which they own interests in, invest, or manage to 55, representing 15,365 units in 13 states. The REIT is currently in the process of becoming an NAV REIT, striking a monthly NAV.
Sources: SEC, Cottonwood Communities, Inc.