James Sprow | Blue Vault |
Blue Vault has been reporting metrics to gauge the performance of nontraded REITs since our beginning in 2009. Given the uniqueness of commercial real estate investments and accounting rules, we have recognized the importance of those financial measures that investors can use to evaluate the sustainability of distributions and the likelihood of capital gains when a life cycle REIT has a liquidity-producing event. With the evolution of the nontraded REIT industry and transition to continuously offered NAV structures, our attention has also been drawn to changes in the net asset values per share that are now reported monthly. It’s the combination of cash distributions to shareholders and the changes in the NAVs per share that add up to total returns to shareholders.
From our earliest reports in Q3 2009, Blue Vault has been reporting the NAREIT-defined Funds from Operations (FFO) as well as Modified Funds from Operation (MFFO). We recognized in 2009 that MFFO was a supplemental measure that could be calculated differently from REIT to REIT. With the IPA’s Practice Guideline 2010-01, the nontraded REIT industry set standards for the computation of MFFO by publicly registered non-listed REITs. Still, not all nontraded REITs reported MFFO per IPA guidelines and for those nontraded REITs, Blue Vault used the financials filed by the REITs to make the necessary adjustments to FFO to add to our reports the calculated MFFO. In every quarterly nontraded REIT report, Blue Vault stated whether the MFFO metric was provided by the REIT following IPA guidelines or was calculated by Blue Vault.
Fast-forward to 2022 and we now have nontraded REITs reporting FFO, MFFO or several variations of funds from operations. Of the 42 active nontraded REITs in Blue Vault’s Nontraded REIT Review as of Q2 2022, all reported FFO, 30 reported MFFO per IPA Guidelines, 11 reported Adjusted FFO (AFFO), and one reported “Core FFO.” Ten of the 11 NTRs reporting AFFO are continuously offered NAV REITs with open offerings.
AFFO makes many of the same adjustments that are made to FFO to arrive at MFFO. The AFFO calculation removes the impacts of a list of non-cash accounting adjustments such as straight-line rents, amortizations of intangibles and mortgage premiums/discounts, unrealized gains or losses, amortization of restricted stock awards and performance participation allocations to Special Limited Partners. (Interestingly, several continuously offered NTRs also report “FAD” or Funds Available for Distribution which adjusts AFFO by subtracting management fees, recurring tenant improvements, leasing commissions and other capital expenditures and realized losses on financial instruments.)
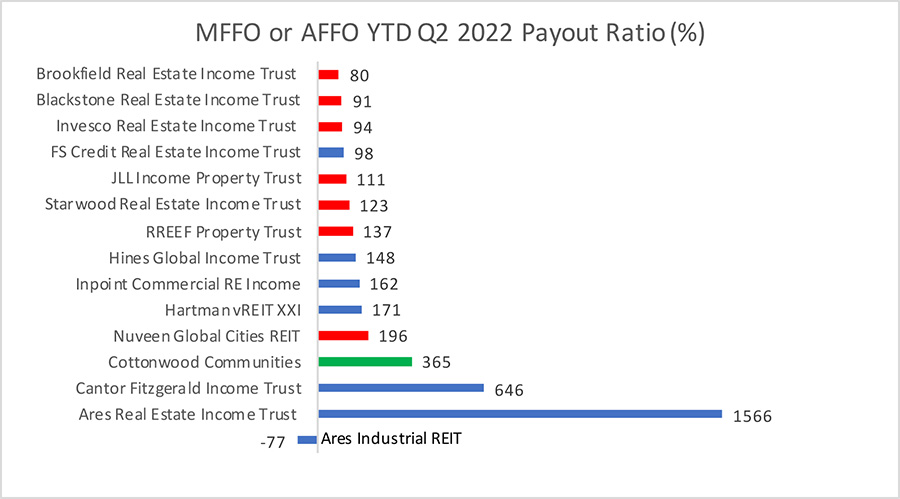
In the following chart, we show the MFFO or AFFO Payout Ratios for the active nontraded REITs for the YTD thru Q2 2022. For those with payout ratios that are less than 100%, the REIT is fully covering its total distributions with FFO that has been adjusted for non-cash accounting entries, better reflecting its ability to sustain its distribution rates. The chart is color-coded with red bars representing REITs that report AFFO and blue bars representing REITs that report MFFO. For most growing nontraded REITs, we’ve observed improvements in these payout ratios over time. One REIT, Cottonwood Communities, reports “Core FFO” represented by a green bar. In the case of Ares Industrial REIT, the payout ratio is negative because MFFO was negative.
In the Blue Vault quarterly reports, the Performance Profiles consider the ratio between MFFO or AFFO and total cash distributions. This metric considers the substantial portion of the REIT’s distributions to shareholders that is reinvested in shares via the REIT’s Distribution Reinvestment Program (DRIP). Since distributions reinvested each quarter in the REIT’s shares, usually at a price per share equal to the previous month’s NAV per share, do not require cash outflows, the sustainability of the REIT’s distributions is enhanced. For many REITs the portion of quarterly cash distributions reinvested in shares via the DRIP is greater than 50%. For example, through June 30, 2022, Blackstone REIT’s distributions reinvested via the DRIP represented 52% of total shareholder distributions. This means that the coverage of cash distributions (the reciprocal of the payout ratio) by AFFO would be greater than 200% and the cash payout ratio would be less than 44%.
Source: Blue Vault Database