Which Nontraded REITs May Be Most Vulnerable to Rising Interest Rates? (Part 1 of 2)
July 31, 2018 | James Sprow | Blue Vault

S&P Global recently analyzed U.S. equity REITs to identify those that could have the greatest vulnerability to rising interest rates. They used two criteria to identify the vulnerability to rising rates: fixed charge coverage and the percentage of the REIT’s debt with variable interest rates. Blue Vault reports interest coverage ratios each year and the percentage of each nontraded REIT’s debt that is at unhedged variable interest rates. Blue Vault also reports the debt principal that is due by each year and the debt-to-assets ratio for each nontraded REIT.
Using the most recent quarterly filings of all nontraded REITs that had significant operations in Q1 2018 and are not in the process of liquidating, Blue Vault identifies those REITs that have the most vulnerability to rising rates using several different metrics as criteria. We must keep in mind that rates are expected to rise over the next few years, but there will be differing impacts due to the shape of the yield curve. Recently we have seen the yield curve flatten as the spread between one-year and ten-year maturities has narrowed. Since real estate refinancing typically is to longer maturities and to fixed rates, as nontraded REITs refinance their short-term variable rate debt, the spread between short and long-term rates will influence the relative impact of refinancing on a REIT’s financial performance. Currently, the impact may be less than we have observed historically.
Shown below are comparisons of the active nontraded REIT programs using the criteria of the percentage of debt at unhedged variable rates as of March 31, 2018, and the percentage of the REIT’s debt principal that must be repaid in 2018 or 2019.
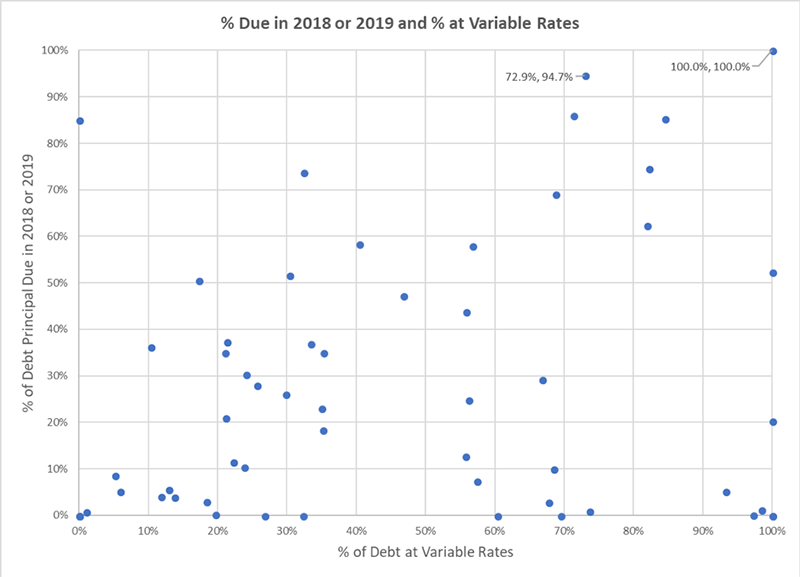
Another two metrics that may reveal a nontraded REIT’s potential vulnerability to rising interest rates are their respective debt-to-assets ratios (i.e. leverage) and their interest coverage ratios (adjusted EBITDA / interest expense). The following chart illustrates those REITs with low interest coverage ratios (below a 2.0X benchmark) and higher debt-to-assets ratios. Generally, the higher REIT’s interest coverage ratio (using the latest full-year ratios for 2017) and the lower debt ratios (as of March 31, 2018) portray potentially lower vulnerability to rising interest rates.
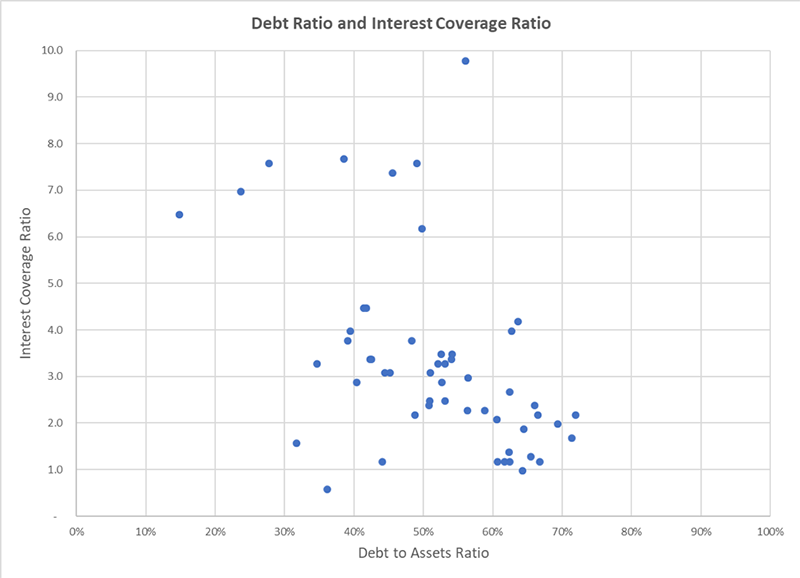
For these metrics for all active nontraded REIT programs, excluding those that were in the process of liquidating or with limited operations as of March 31, 2018, see the following tables:
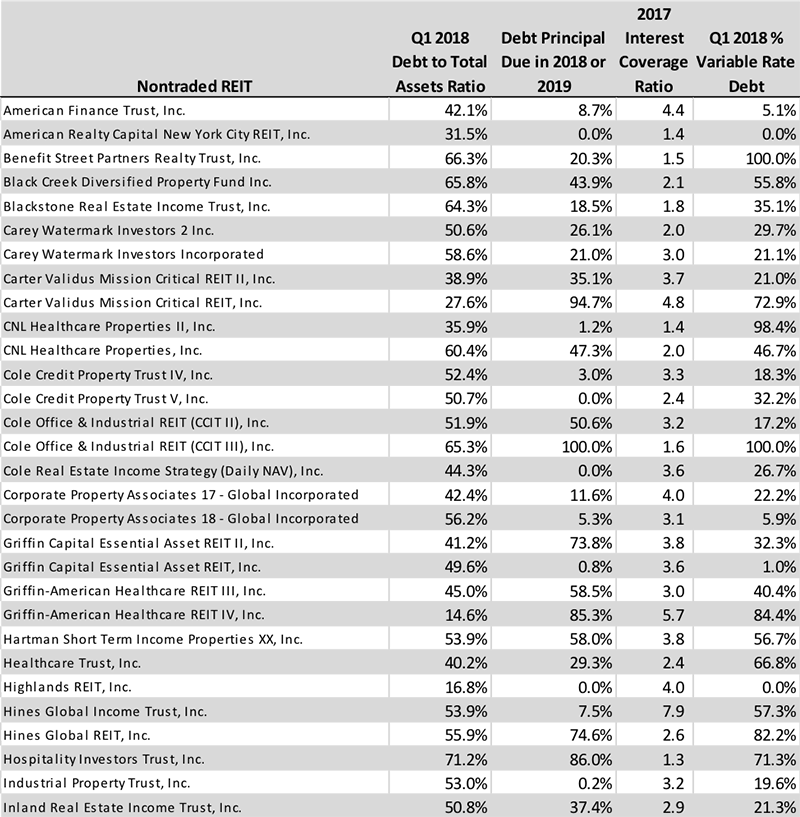
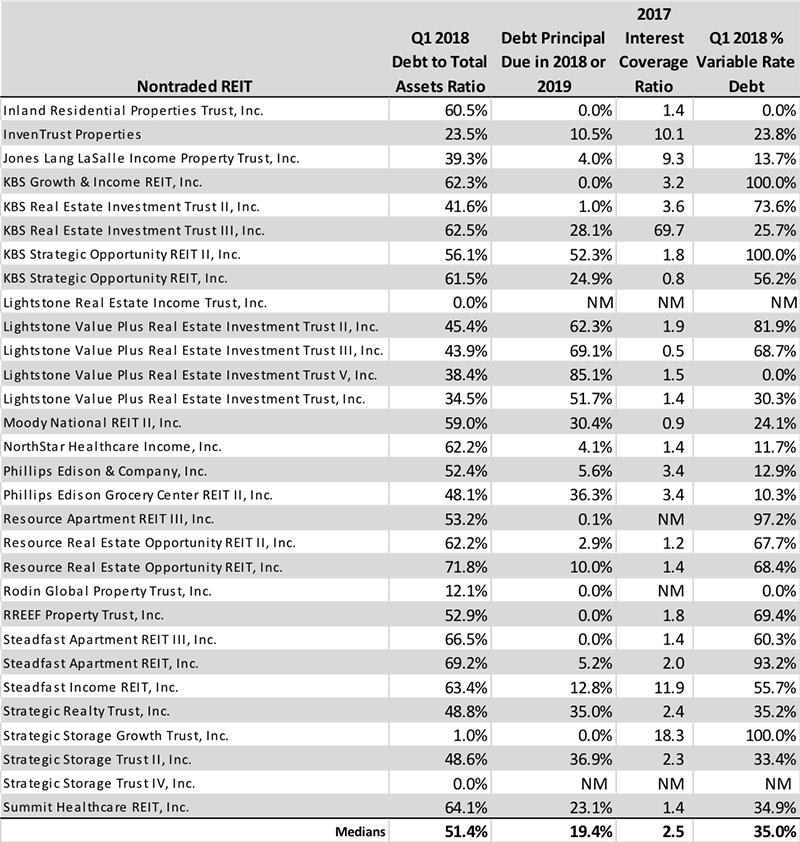
Stay tuned for Part 2 of this article which will identify REITs with potentially higher risk assessments related to their debt, as analyzed by Blue Vault.


