Johnathan Rickman | Blue Vault
No two funds are alike. It’s an old saw, but one that’s true. Besides product structure and strategy, management style and market forces can also impact individual funds differently.
But not all impacts are readily apparent. That’s where due diligence — and data — comes into play. Blue Vault’s research improves the transparency of industry data, giving wealth advisors the confidence they need to make informed investment decisions for their clients.
With alternative investment firms rallying around private credit and flooding the market with new such opportunities, clarity becomes ever more important.
Battle of the BDCs
Take for instance two different, and successful, nontraded debt BDCs: BlackRock Private Credit Fund and Blackstone Private Credit Fund. Both offerings seek to provide income-focused investors with monthly distributions via senior secured loans to U.S. companies.
On the surface, both funds have similar distribution yields and NAVs in the mid-twenties:
| Nontraded BDC | Q2 2025 Distribution Yield (I Share) | Q2 2025 NAV |
| BlackRock Private Credit Fund | 11.39% | $24.24 |
| Blackstone Private Credit Fund | 10.49% | $25.17 |
Both offerings’ 2025 year-to-date performance returns (I shares) were also competitive at 3.35% (BlackRock) and 4.30% (Blackstone), respectively. Those results also outperformed the Morningstar LSTA Leveraged Loan Index, which posted at 3.21% for the same period.
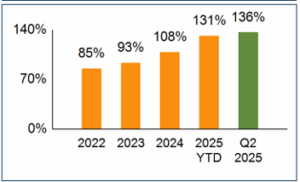
But as you dig deeper into the data, a different story emerges. While BlackRock’s offering has historically paid a higher distribution rate, the firm’s net investment income (NII) payout ratios have exceeded 100% since 2024 and continue to increase, indicating its current distribution rate likely isn’t sustainable under current operations:
BlackRock Private Credit Fund – Historical NII Payout Ratio
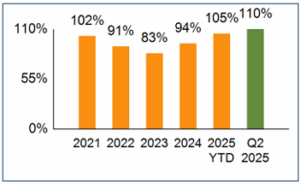
Blackstone’s recent payout ratios have also exceeded 100%, but with steadier results:
Blackstone Private Credit Fund – Historical NII Payout Ratio
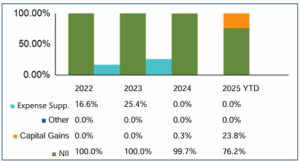
While Blackstone’s distributions have been fully covered by its NII, BlackRock has partially funded its distributions from capital gains:
BlackRock Private Credit Fund – Sources of Distribution
More Metrics and Industry Intel
The two offerings differ in other areas that could impact their performance. The BlackRock BDC holds far fewer total assets — $1.8 billion — than the Blackstone BDC’s $76.7 billion (as of June 30, 2025). Blackstone is also the industry leader in fundraising, having generated approximately $32.2 billion in its public offering since being introduced in 2021, including $2.2 billion in the second quarter of this year.
Blackstone’s girth also gives them more wiggle room to operate. Their BDC’s gross and net operating expense ratios in Q2 2025 were both 3.13%, while the BlackRock BDC’s Q2 ratios came in at 3.41% for the same period.
Meanwhile, each alternative investment firm has been busy making waves in the market that could potentially impact its investment products. For instance, BlackRock in July bought HPS Investment Partners, acquiring its nontraded BDC, the HPS Corporate Lending Fund, with it. For its part, Blackstone has been funneling billions of dollars into various joint ventures. The alternative investment giant also recently launched a Delaware Statutory Trust program.
There’s a lot that goes into due diligence. Building trust and relationships with sponsors is crucial for creating positive outcomes for clients. But access to independently sourced data is the ace in every advisor’s sleeve, giving them the confidence to make decisions.
Blue Vault tracks nontraded BDCs as part of our research into private markets for credit, real estate, and equity. Learn about Blue Vault membership and events, including our webinars and Alts and Answers Luncheons connecting advisors and sponsors. Our unparalleled performance data can help build your advisory practice. Are you an asset manager, broker-dealer, or other entity? Contact us today to see how we can help you.