
Mr. Schwaber serves as the Chief Executive Officer of Bluerock Capital Markets and oversees the company’s capital markets, securities sales and distribution operations. As a 32-year veteran of the securities industry, Jeff brings a wealth of executive-level experience to Bluerock.
Jeff’s diverse career accomplishments include senior executive roles in several key areas of the investment and securities industries. Prior to joining Bluerock, Jeff previously served as President and Head of Distribution for Griffin Capital and EVP and Head of Distribution for Behringer Harvard, two leading industry companies. Since 2003, Jeff has overseen the equity raise of over $13 Billion, making him one of the most successful and highest capital raising executives in the history of the direct investment industry.
New York, NY (June 8, 2018) – Bluerock’s Total Income+ Real Estate Fund (“Fund” or “TI+”, tickers: TIPRX, TIPPX, TIPWX, TIPLX) announced today that it surpassed $1 Billion in assets under management on June 4, 2018.
TI+ seeks to provide individual investors with access to an elite group of institutional real estate managers previously only available to the largest institutions and pensions and is designed to meet the needs of individual investors seeking high tax-efficient income with lower volatility and correlation to the broader markets with annual appreciation for attractive total returns.
“Surpassing $1 Billion in assets under management is tremendous validation of TI+’s performance,” said Jeffrey Schwaber, Chief Executive Officer of Bluerock Capital Markets. “Further, in April, TI+ achieved its highest monthly capital raise since its inception, and then erupted with a 33% increase from April’s then record capital raise with nearly $50 million of capital inflows in May. Based upon reliable data points, TI+ is not only experiencing substantial increases in existing advisor and new producer inflows but also usurping market share from its peer group. We expect this uptrend to continue because, as it should, capital generally follows performance”, Mr. Schwaber added.
|
From its inception through May 2018, TI+ has generated total annualized returns of 8.21%, including 18 consecutive quarterly distributions at the current annualized rate of 5.25%*. Importantly, in addition to paying an attractive current income distribution to shareholders represented by more than $7.42/share since inception, TIPRX (A-share) net asset value (NAV) has generated robust capital appreciation of 20% for a total cumulative return of 55.64%. The Fund has achieved this performance with 85%+ lower volatility (as measured by annualized standard deviation) than leading stock and REIT indexes1. 1Morningstar Direct. Indexes with respective annualized standard deviations: Stocks: S&P 500, 14.98%; REITs: MSCI U.S. REIT Index, 17.57%, TI+ Fund, 1.94%. |
 |
|
About Total Income+ Real Estate Fund To date, the Fund has made investments into underlying securities that collectively include over $165 billion in real estate assets, comprising approximately 2,900 properties across the United States with a combined average occupancy of 93% and a low 26% weighted average loan to value ratio. |
“Surpassing $1 Billion in assets under management is tremendous validation of TI+’s performance,…” |
TI+ A Share Fund Performance
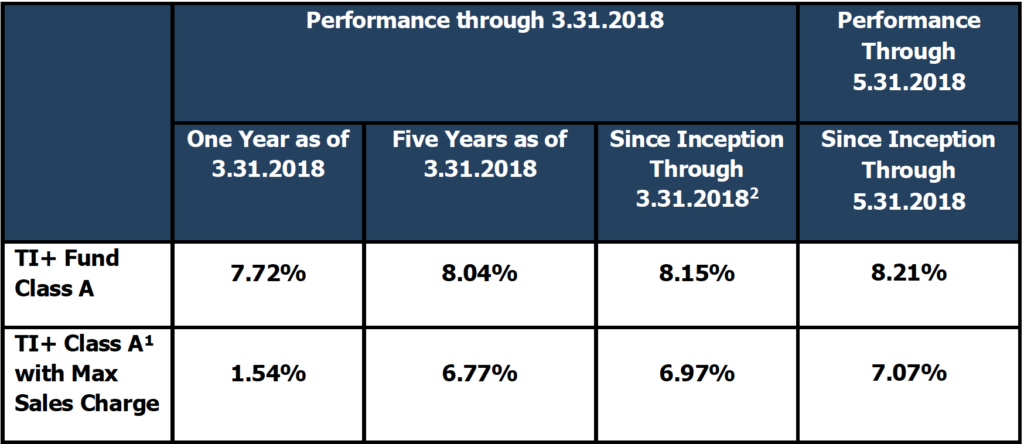
1The maximum sales charge for the Class A shares is 5.75%. Investors may be eligible for a waiver or a reduction in the sales charge.
2Inception date of the Fund is October 22, 2012.
The performance data quoted here represents past performance. Current performance may be lower or higher than the performance data quoted above. Investment return and principal value will fluctuate, so that shares, when redeemed, may be worth more or less than their original cost. For performance information current to the most recent month end, please call toll-free 1-888-459-1059. Past performance is no guarantee of future results.
The total annual fund operating expense ratio, gross of any fee waivers or expense reimbursements, is 2.38% for Class A, 3.12% for Class C, 2.15% for Class I, and 2.69% for Class L. The Fund’s investment adviser has contractually agreed to reduce its fees and/or absorb expenses of the fund, at least until January 31, 2019 for Class A, C, I and L shares, to ensure that the net annual fund operating expenses will not exceed 1.95% for Class A, 2.70% for Class C and 1.70% for Class I, and 2.20% for Class L, per annum of the Fund’s average daily net assets attributable to Class A, Class C, Class I, and Class L shares, respectively, subject to possible recoupment from the Fund in future years. Please review the Fund’s Prospectus for more detail on the expense waiver. A Fund’s performance, especially for very short periods of time, should not be the sole factor in making your investment decisions. Fund performance and distributions are presented net of fees.
For copies of TI+ public company filings, please visit the U.S. Securities and Exchange Commission’s website at www.sec.gov or the Company’s website at www.bluerockfunds.com.
Investing in the Total Income+ Real Estate Fund involves risks, including the loss of principal. The Fund intends to make investments in multiple real estate securities that may subject the Fund to additional fees and expenses, including management and performance fees, which could negatively affect returns and could expose the Fund to additional risk, including lack of control, as further described in the prospectus. The Fund’s distribution policy is to make quarterly distributions to shareholders. The level of quarterly distributions (including any return of capital) is not fixed and this distribution policy is subject to change. Shareholders should not assume that the source of a distribution from the Fund is net profit. A portion of the distributions consist of a return of capital based on the character of the distributions received from the underlying holdings, primarily Real Estate Investment Trusts. The final determination of the source and tax characteristics of all distributions will be made after the end of each year. Shareholders should note that return of capital will reduce the tax basis of their shares and potentially increase the taxable gain, if any, upon disposition of their shares. There is no assurance that the Company will continue to declare distributions or that they will continue at these rates. There can be no assurance that any investment will be effective in achieving the Fund’s investment objectives, delivering positive returns or avoiding losses.
Investors should carefully consider the investment objectives, risks, charges and expenses of the Total Income+ Real Estate Fund. This and other important information about the Fund is contained in the prospectus, which can be obtained online at www.bluerockfunds.com. The Total Income+ Real Estate Fund is distributed by ALPS, Inc. The prospectus should be read carefully before investing. Bluerock Fund Advisor, LLC is not affiliated with ALPS, Inc.
* The Fund’s distribution policy is to make quarterly distributions to shareholders. The level of quarterly distributions (including any return of capital) is not fixed. However, this distribution policy is subject to change. The Fund’s distribution amounts were calculated based on the ordinary income received from the underlying investments, including short-term capital gains realized from the disposition of such investments. Shareholders should not assume that the source of a distribution from the Fund is net profit. A portion of the distributions consist of a return of capital based on the character of the distributions received from the underlying holdings, primarily Real Estate Investment Trusts. The final determination of the source and tax characteristics of all distributions will be made after the end of the year. Shareholders should note that return of capital will reduce the tax basis of their shares and potentially increase the taxable gain, if any, upon disposition of their shares. There is no assurance that the Company will continue to declare distributions or that they will continue at these rates.
Definitions
MSCI US REIT Index (Public REITs): A free float-adjusted market capitalization weighted index comprised of equity REITs that are included in the MSCI US Investable Market 2500 Index, with the exception of specialty equity REITs that do not generate a majority of their revenue and income from real estate rental and leasing operations. The index represents approximately 85% of the US REIT universe (www.msci.com). Returns shown are for informational purposes and do not reflect those of the Fund. You cannot invest directly in an index and unmanaged indices do not reflect fees, expenses or sales charges. Risks include rising interest rates or other economic factors that may negatively affect the value of the underlying real estate.
S&P 500: An index of 500 stocks chosen for market size, liquidity and industry grouping, among other factors. The S&P 500 is designed to be a leading indicator of U.S. equities and is meant to reflect the risk/return characteristics of the large cap universe (Investopedia).
Annualized standard deviation: The standard deviation of the daily percentage change in an investment. Standard deviation shows how much variation from the average exists with a larger number indicating the data points are more spread out over a larger range of values.

Learn more about Bluerock Real Estate on the Blue Vault Sponsor Focus page

Bluerock’s Interval Fund Maintains Distribution Rate
Bluerock Value Exchange Sells Out Class A Multifamily San Antonio, Texas 1031 Exchange Offering
Bluerock Residential Growth REIT Announces Share Repurchase Plan