Johnathan Rickman | Blue Vault
With market volatility making it more difficult for banks to justify lending, small- and mid-size companies are increasingly turning to nontraded business development companies (BDCs) for growth funds, creating new opportunities for entrepreneurs and investors alike.
Since the end of 2021, nontraded BDCs have more than quadrupled their total assets, increasing interest in the industry and fueling a steady incline in fundraising. Eight product sponsors, including Fidelity and PGIM, launched new products that became operational in 2023, while First Eagle and three other firms registered or launched new products last year.
As the first quarter of 2025 came to a close, investors saw several positive impacts from the industry upsurge, including an average distribution yield of 8.77% and abounding opportunities with 21 open funds currently raising capital.
With the private credit market projected to grow between $2.8 and $3.5 trillion by 20281, nontraded BDCs stand to play an important role in diversifying portfolios and generating income for investors for years to come. Now, let’s take a closer look at the data2 and the metrics that have helped spur the recent boom in nontraded BDCs.
Capital Raise
Public capital raise for the industry reached a historical high in the first quarter of 2025, generating an estimated $9.4 billion, including DRIP proceeds. This is up from $7.5 billion raised in Q4 2024. Private fundraising in the first quarter of this year came in at about $3.5 billion, up from $2.3 billion the previous quarter and $1.9 billion in the first quarter of 2024.
Some of the biggest industry fundraisers include Blackstone, whose Blackstone Private Credit Fund has generated approximately $30.0 billion in its public offering since being introduced in 2021. The following were the top five fundraisers in the first quarter of 2025:
|
Nontraded BDC |
Effective Date |
2025 Public Capital Raise |
|
Blackstone Private Credit Fund |
1/7/2021 |
$2.2 billion |
|
Blue Owl Credit Income Corp. |
11/10/2020 |
$1.8 billion |
|
Ares Strategic Income Fund |
12/5/2022 |
$1.6 billion |
|
HPS Corporate Lending Fund |
2/3/2022 |
$1.2 billion |
|
Apollo Debt Solutions BDC |
1/7/2022 |
$795 million |
Not only is Blackstone the industry leader in fundraising, but it also reported the most assets at $73.7 billion. That’s more than double the runner-up’s asset total. Blue Owl Credit Income Corp., ranked second, owned $30.4 billion in assets as of March 31, 2025. As of the same date, the nontraded BDC industry managed $192.8 billion in total assets.
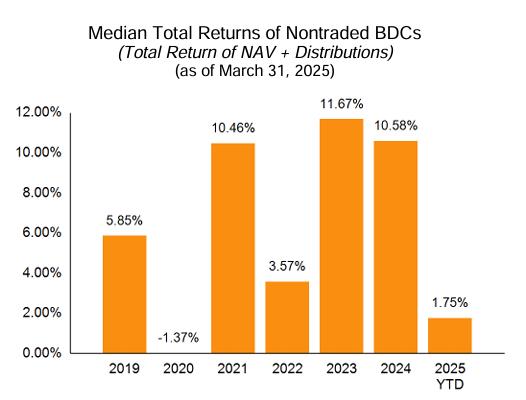
Total Return and Distribution
Returns for the year started off strongly with the median industry return in Q1 2025 coming in at 1.75% and the average return at 1.57%. Both of those metrics were slightly higher for BDCs actively raising funds (1.77%, respectively). Note: The median and average industry returns only include those funds that were in operation for the entire quarter.
This follows two strong years of total returns for the nontraded BDC industry:
As of March 31, 2025, BlackRock Private Credit Fund and PGIM Private Credit Fund had the highest distribution yields across share classes:
|
Nontraded BDC |
D Share |
I Share |
S Share |
|
PGIM Private Credit Fund |
10.92% |
11.54% |
10.11% |
|
BlackRock Private Credit Fund |
10.88% |
11.30% |
10.08% |
Kennedy Lewis Capital Company, which launched in June 2024, generated a distribution yield of 11.16% for its I share in Q1 2025. Other BDCs with double-digit distribution yields for their I shares in Q1 include TPG Twin Brook Capital Income Fund (10.60%), Blackstone (10.46%), and Oaktree Strategic Credit Fund (10.31%).
Redemptions
Redemption rates for nontraded BDCs in the first quarter were overall very low or nonexistent. Many of these funds are relatively new and most have performed well over the past few years, leading to fewer shareholders seeking to cash out.
That said, Blue Owl Technology Income Corp. had the highest redemption rate in Q1 2025 at 3.28%, down slightly from the previous quarter. In fact, most BDCs’ redemption rates fell in the first quarter following higher-than-usual redemption requests the previous quarter.
The Outlook
The nontraded BDC industry has had an impressive start to 2025. When asked to provide an outlook for the rest of the year, Luke Schmidt, Vice President, Director of Research at Blue Vault, said the industry has the potential to build on its first quarter results.
“If the funds can maintain low delinquencies and defaults on their loans through the remainder of the year, as they’ve done over the past couple years, 2025 will shape up to be one of the best in the industry’s history,” Schmidt said.
Learn about Blue Vault membership and how our performance data can help build your advisory practice. Are you an asset manager, broker-dealer, or other entity? Contact us today to see how we can help you.
References
1 Private Debt: The multi-faceted growth drivers | BlackRock
2 Blue Vault BDC Industry Review: First Quarter 2025