Digging Deeper into American Finance Trust Valuation (start with $2 Million)
July 25, 2018 | James Sprow | Blue Vault

There’s the old saying about how any fool can become a millionaire. First, start with two million.
American Finance Trust (“AFIN”) in its Q1 2018 presentation to stockholders reported its portfolio of 558 retail properties as of March 31, 2018, with a total cost of $3.5 billion. The company’s independent directors unanimously approved an estimated per share net asset value of $23.56 as of December 31, 2017, and published that value on March 20. On May 22, 2018, the company announced that it had engaged BMO Capital Markets Corp. to provide strategic advice to the REIT related to potential positioning in the public markets. A listing on Nasdaq had been approved in August 2017.
The company listed 50% of its outstanding common shares on the Nasdaq on July 19, 2018, and it closed that day at $15.00 per share. On July 23, four days later, it closed at $14.22 and opened trading on July 25 at $13.85. The book value of the company’s equity on March 31, 2018, was approximately $16.35 per share. Total assets were $3.24 billion and total liabilities were $1.52 billion, for a net equity position of $1.72 billion with over 104 million shares outstanding. The real estate assets, net of accumulated depreciation, had a book value of $3.07 billion. Of course, all of these numbers from the company’s balance sheet are presented according to GAAP, which are based upon historical cost and may bear little resemblance to current market values. The question we must ask, and shareholders must be asking, is “How does a company announce a net asset value per share of $23.56 as of December 31, 2017, and begin trading at roughly 64% of that value less than seven months later?”
According to the company’s SEC filing on March 19, 2018, Duff & Phelps, an independent third-party valuation firm, performed appraisals in accordance with the Investment Program Association’s Practice Guideline 2013-01. Duff & Phelps performed a sensitivity analysis, using a low, midpoint and high range of capitalization rates which were used in its valuations of individual properties. The result of this analysis was a range for the estimated NAV per share of a low of $21.37 to a high of $23.56, with a midpoint of $22.43.
Why did the REIT’s independent directors unanimously adopt the highest estimated NAV from the range of NAVs calculated by Duff & Phelps? In Blue Vault’s experience with NAV estimates, this use of the higher estimated NAV based upon lower capitalization rates is unusual. Virtually all the NAV announcements that we have seen have had values based upon the mid-range estimates. Clearly, the REIT’s Advisor had some input into the decision, as the filing makes clear (italics added):
The independent directors of the Board based their determination on the Advisor’s recommendation, which was based on the Advisor’s review of the Duff & Phelps Real Estate Appraisal Report and on the Advisor’s own analysis, estimates and calculations and the other factors described herein, but the Board is ultimately and solely responsible for the Estimated Per-Share NAV.
The REIT explains some limitations of the estimated per-share NAV in their March 20 filing (italics added):
Limitations of the Estimated Per-Share NAV
The Estimated Per-Share NAV does not reflect “enterprise value” which may include an adjustment for:
• the large number of Real Estate Assets, given that some buyers may be willing to pay more for a large portfolio than they are willing to pay for each property in the portfolio separately;
• any other intangible value associated with a going concern; or
• the possibility that the Company’s shares could trade at a premium or a discount to Estimated Per-Share NAV if the shares were listed on a national securities exchange.
The Estimated Per-Share NAV also does not represent the amount that:
• the Company’s shares may trade on a national securities exchange or a third party would pay for the Company;
• a stockholder would obtain if he or she tried to sell his or her shares; or
• a stockholder would realize in per share distributions if the Company sold all of its assets and settled all of its liabilities in a plan of liquidation.
The limitations listed above do not explain the board’s logic in selecting the higher estimated NAV per share. The filing does make clear that, based upon the estimate, in a hypothetical liquidation, the Advisor would not be entitled to any incentive fees or performance-based restricted partnership units (“Class B Units”) as of December 31, 2017.
The following table shows the components of the estimated NAV per share approved by the board:
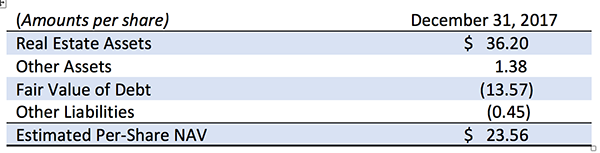
On December 31, 2017, the date of the board’s estimated NAV per share, the REIT reported 540 retail properties with a combined 19.43 million square feet and a cost basis of $3.51 billion. On March 31, 2018, the portfolio consisted of 558 retail properties with a combined 19.07 million square feet and a cost basis of $3.45 billion. Assuming that the three categories (Other Assets, Fair Value of Debt, Other Liabilities) are not as sensitive to certain assumptions about market conditions, cap rates, etc. as the value of the Real Estate Assets category, it might be fair to ask, given that the REIT’s asset portfolio has been relatively stable (lower by just 1.7% on a cost basis) since December 31, 2017, “How much discount is the market applying to AFIN’s real estate assets to arrive at the recent share price and its discount to the December 31, 2017, estimated NAV?”
Using the $13.85 opening price per share on July 25, the answer is a rather startling 27% discount to the estimated value of the REIT’s real estate assets as of December 31, 2017. Only 1.7% of that discount may be attributed to the reduced book value of the cost of those assets. The remainder can only be explained by other factors, such as increases in market capitalization rates. Realistically, the discount from the REIT’s estimates of its portfolio value must in large part be due to the market’s lack of confidence in the management of the REIT. Had the Advisor recommended the middle value of the estimated net asset value per share back in December ($22.43), the discount observed recently would not be as severe.
According to S&P Global’s Cap Rate Monitor, average capitalization rates for a sample of retail REITs have increased from 6.77% for Q4 2017 to 6.90% for Q1 2018. According to AFIN’s filing that reported its estimated NAV per share on March 20, 2018, along with a sensitivity analysis that considered changes in cap rate assumptions. that 13 basis point variation in cap rates would reduce the share value estimate by less than 3%.
We will continue to explore the reasons for the poor performance of AFIN in its exchange listing in future articles.
Sources: SEC, Blue Vault

Learn more about AR Global on the Blue Vault Sponsor Focus page

American Realty Capital New York City REIT Closes $12.95 Self-Tender
MacKenzie Realty Capital’s Tender for All Classes of AFIN Shares